How to Create Graphs in the OTBI Report: Graphical Representation of the Data in the OTBI report
OTBI reports in Oracle Cloud is the new reporting tools. This helps to create the reports with only drag and drop option. We don't need SLQ Expertise for this to design and developed the reports. In OTBI , Oracle Cloud has provided many other features too. We can easily designs the graphical reports with the help of this tool. This tool helps to provide the graphical representation of the data. Graphical representation means that , We can create Bar graphs , PI chart and many other number of Graphical presentations of the Data. This Helps to design and provide the Business MIS reporting's too. Here below I will share the steps to Create Graphs in the OTBI Report
Step by Step to Create and Designs Graphs in the OTBI Report
Step1:-Go to Tools and Reports and analytics.
Step2:- As below Click on the Reports and Analytics.
Step4:- As Highlighted Below , Go to New ==> Analysis
Step5:- As below this is the Subject Area , We need to Carefully Select the Subject Area.
Oracle cloud has Created the Subject Areas as per the Module and Business Functions wise. In this Example , I Will show the Supplier Liability Month wise in the Graph Format So I will select the 'Payable Invoices - Transaction Real Time'.
This Subject area will show the AP invoices Information's.
Oracle cloud has Created the Subject Areas as per the Module and Business Functions wise. In this Example , I Will show the Supplier Liability Month wise in the Graph Format So I will select the 'Payable Invoices - Transaction Real Time'.
This Subject area will show the AP invoices Information's.
Step6:-
As below this is the OTBI Designing Part. In the Left we are seeing the Folder and Subfolders.
Oracle Cloud has grouped the Invoices Information's as per the Folder Wise. So As per the Information's we need in the OTBI report , We need to go to that Desired Folder and Drag and Drop the Column under this Folder to Selected Columns area.
Step7:- Here below Under Supplier Folder , We have Drag and Drop the Supplier and Supplier Number Column in the Selected Columns.
Step8:- Now Under General Information's Folder , Drag and Drop the Invoice Amount and Invoice Date in the Subjected Area.
Step9:- As below , As such I need Only Month and Year from Invoice Date then , We need to do below changes to Convert Full Date to Month and Year.
Click on the * Icon ==> Column Properties
Step9:- Under Date Format
Select Override Default data Format.
Date Format : Custom
Custom Date Format : MM-YY
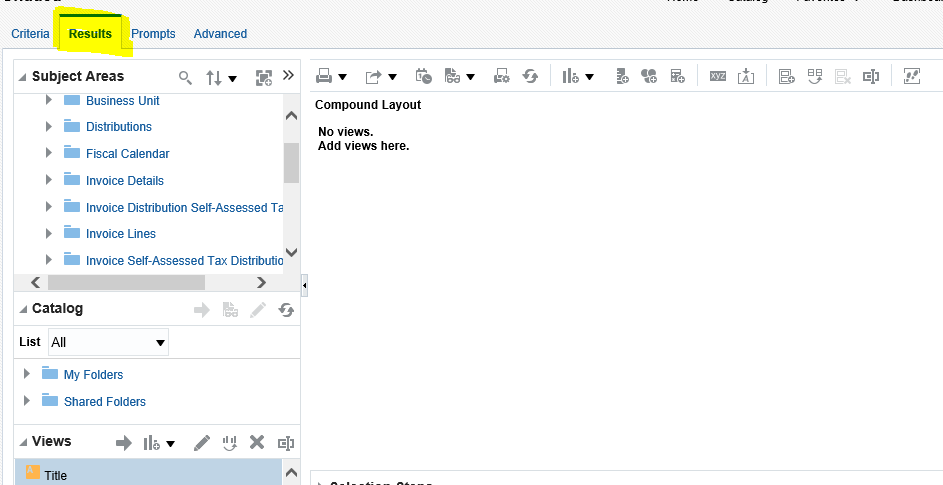
Step10:- To see the Output of the OTBI report , We need to Click on the Results Tab.

Step11:- Now in the Results Tab , first Delete all the Default Outputs as below.
Step11:-Now under Results , Go to Bar Highlighted Below and Select Graph and BI.
Step12:-
Now OTBI report will show the Default Graph Chart but this is not Right. We need to do many changes in this Output to show the Graph Information's as per Our Requirment.
This Article is quite long , so I have split this in two Parts. For Second Part you can refer this Below Post.
How to Create Graphs in the OTBI Report: Graphical Representation of the Data in the OTBI report


0 comments:
Post a Comment